Showing posts with label visual. Show all posts

Dec 2, 2012

EpiCollect: A mobile app, useful for photo + data-collection "in the wild".

EpiCollect is an open-source project developed at Imperial College London, funded by the Wellcome Trust.  According to information posted on the project's website, "EpiCollect is a generic data collection tool that allows you to collect and submit geotagged data forms (along with photos) to a central project website (hosted using Google's App Engine) from suitable mobile phones (Android or iPhone). For example, questionnaires, surveys, etc.  All data synchronised (ie a copy sent from the phone) from multiple phones can then be viewed/charted/filtered at the project website using Google Maps/Earth or downloaded. Furthermore, data can be requested and viewed/filtered from the project website directly on your phone using Google Maps." -EpiCollect

EpiCollect Overview  epicollect.net
(Credit:  EpiCollect Website)

EpiCollect makes use of web API's such as Google Maps, Google Charts, Google Talk, and KML Specifiction, and JavaScript Libraries such as JQuery, script.aculo.us, ExtJS, and Mapstraction.  It runs on the Google AppEngine server, and is available for Android and iPhone.

I think that EpiCollect would be a useful interactive tool for use in education, K-12 and above.  It would be ideal for students working on group projects, such as environmental study.  For young children, a simple assignment might include taking pictures and data about  birds, animals, trees, cloud formations, or even litter, as part of a class project.  Since the data includes photographs, the students could create an end product in the form of an interactive multimedia presentation, available for other students - as well as parents- to view on the web, accessed from any web-enabled device.

HCI research teams could use these tools when observing people using various technologies in public spaces, such as malls, airports, special events, as well as in stores, eateries, and entertainment settings.  

I would be interested in learning more about the use of this application in HCI and K-12 education!

RELATED
EpiCollect Website
EpiCollect Instructions
EpiCollect Instructions (pdf)
The Sight of Road Kill Makes a Pretty, Data-Rich Picture (NPR All Tech Considered)
Note: Audio from the above December 2, 2012 episode can be found on the NPR Weekend Edition Sunday website after 12:00 PM ET on 12/2/12
Mobile app sees science go global  (BBC article)
App for Android Puts Laboratories on Your Phone (Tree Hugger article)
Scientific Data Collection Goes Mobile (Discovery News article)

Paper: EpiCollect: Linking Smartphones to Web Applications for Epidemiology, Ecology and Community Data Collection (PLos One 4(9), 2009)

David M. Aanensen, Derek M. Huntley, Edward J. Feil, Fada'a al-Own, Brian G. Spratt
Conclusion from the above paper:
"Data collection frameworks utilising mobile phones with data submission to and from central databases are widely applicable and can give a field worker similar display and analysis tools on their mobile phone that they would have if viewing the data in their laboratory via the web. We demonstrate their utility for epidemiological data collection and display, and briefly discuss their application in ecological and community data collection. Furthermore, such frameworks offer great potential for recruiting ‘citizen scientists’ to contribute data easily to central databases through their mobile phone."

Nov 12, 2012

Video: Overview of Multimedia Learning Principles, Importance of Visual Learning, Richard Mayer

Richard Mayer has devoted his career to the study of multimedia learning. He is a professor in the Department of Psychological & Brain Sciences at UC Santa Barbara, and the author of Multimedia Learning, 2nd Edition. Although the book was published in 2009, years ago, it is a must-read for anyone interested in this topic.

With the popularity of interactive whiteboards and tablets/iPads in education, it is important for educators, designers and developers to become familiar with the basic principles of multimedia learning. It is also important subject for researchers.

Apr 30, 2011

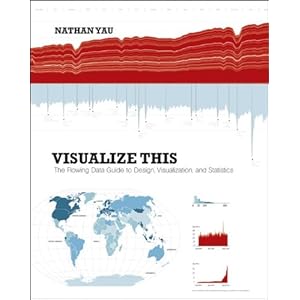
"Visualize This": Nathan Yau's (FlowingData) book about information and data visualization

I've been following Nathan Yau's FlowingData blog for several years.  It is one of my favorites. His new book,  Visualize This : The FlowingData Guide to Design, Visualization and Statistics, will be out in July 2011, and is available for  pre-order on-line on Amazon, Barnes&Noble, and Wiley.  


I love Nathan's editor's comment about his latest chapter: "Thanks for yet another very enjoyable chapter.  If I had known statistics would be like this, I would have actually taken classes"


Visualize This: The Flowing Data Guide to Design, Visualization, and Statistics


Here is the plug for Visualize This, from the Wiley website:


"Data doesn't decrease; it is ever-increasing and can be overwhelming to organize in a way that makes sense to its intended audience. Wouldn't it be wonderful if we could actually visualize data in such a way that we could maximize its potential and tell a story in a clear, concise manner? Thanks to the creative genius of Nathan Yau, we can. With this full-color book, data visualization guru and author Nathan Yau uses step-by-step tutorials to show you how to visualize and tell stories with data. He explains how to gather, parse, and format data and then design high quality graphics that help you explore and present patterns, outliers, and relationships.
  • Presents a unique approach to visualizing and telling stories with data, from a data visualization expert and the creator of flowingdata.com, Nathan Yau
  • Offers step-by-step tutorials and practical design tips for creating statistical graphics, geographical maps, and information design to find meaning in the numbers
  • Details tools that can be used to visualize data-native graphics for the Web, such as ActionScript, Flash libraries, PHP, and JavaScript and tools to design graphics for print, such as R and Illustrator
  • Contains numerous examples and descriptions of patterns and outliers and explains how to show them
Visualize This demonstrates how to explain data visually so that you can present your information in a way that is easy to understand and appealing."

Jul 15, 2009

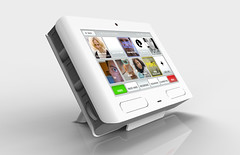
Kicker Touchscreen Conference Phone (front)


Kicker Touchscreen Conference Phone (front)
Originally uploaded by Kicker Studio

I am a fan of the work by Kicker Studios. I especially enjoy reading their blog that gives great details about how product design is done. I always come away from the blog with something new.

In the case of the touch-screen conference phone, the designers focused on their own needs, since they spend a chunk of time in conference calls. To get a closer look at the design process behind this phone, see the blog post, " Product Concept: Touch Screen Conference Phone".

RELATED

The 30 Most Influential Interactive Products

Aug 6, 2007

About Displays

From time-to-time I will share information about displays under the heading "About Displays"

Why? When I set out to learn more about display hardware and related technologies that support interactive multimedia applications, I quickly discovered that things are changing - fast. Some of the technology is complex.

I will post a list of research articles and related information soon. I know that my list is missing some pieces, as it is difficult to keep up with important changes. For this reason, I'm asking my readers to help me out by posting a comment about display-related information to share with others when you come across something interesting and useful.

Here is an example of something worth sharing:

Dolby Acquires BrightSide

"The DR37-P is a spectacular breakthrough in display technology. It uses an array of individually modulated LED backlights to provide 10 times the brightness and 100 times the contrast of existing television and computer monitors. The Extreme Dynamic Range display delivers more vibrant images, enabling you to see information onscreen in vivid detail."

"In an HDR-enabled display, the backlight consists of an array of ultrahigh-brightness white or tricolor light-emitting diodes (LEDs). Each LED can be controlled individually—faster than video refresh rates. The lower-resolution LED image is then projected through a standard LCD panel, which displays a high-resolution version of the image, resulting in a vibrant display."

A display with HDR technology might be something to consider for use with people with visual impairments, which are more commen among the elderly.

Links to whitepapers, screen shots, and interactive demos are welcome!

HDRInteractive Demo

Jul 21, 2007

Interactive web-based science and math: Link to my TechPsych post about ExploreLearning Gizmos


ExploreLearning is a website that offers a variety of engaging math and science activities, called "Gizmos", for students in grades 6-12.


ExploreLearning's Gizmos would be great on large touch-screen surfaces or displays, such as a NextWindow Human Touch, a SmartBoard, or Microsoft's Surface.

Since the activites are designed as learning modules and are web-based, the Gizmos might even work on iPhones!

Check out my TechPsych post for more information and links.

Photo courtesy of ExploreLearning.

Jun 22, 2007

Visual and Multimedia Literacy: 500 Years of Women Art


Here is an example of the importance of visual and multimedia literacy, I thought I'd share this YouTube video clip of paintings of women's faces as they morph from one to another, depicting the last 500 years of art. In just under three minutes, the viewer gets a deeper understanding of the concept.

Jun 18, 2007

Direct link to the Rome Reborn 1.0 website

I did a little hunting and found the main website for Rome Reborn 1.0, at the Institute for Advanced Technology in the Humanities at the University of Virginia. Here is a blurb from the website about the history of Rome Reborn:

"From 1997 to 2007 the UCLA Cultural Virtual Reality Laboratory (CVRLab), the UCLA Experiential Technology Center (ECT), the Reverse Ingineering (INDACO) Lab at the Politecnico de Milano, and the Institute for Advanced Technology in the Humanities (IATH) of the University of Virginia collaborated on a project to crate a digital model of ancient Rome as it appeared in late antiquity...."

News video about Rome Reborn:


Links:
UCLA Cultural Virtual Reality Lab
UCLA Experiential Technology Center
Institute for Advanced Technology in the Humanities
Politecnico di Milano

Aug 21, 2006

The Importance of Media Literacy - Link to Quotes

This is a link to quotes from a variety of people about media literacy.

The quotes were posted on the Media Literacy Clearinghouse Website. If that link does not work, try this one. The Media Literacy Clearninghouse has a variety of resources for K-12 educators.

Aug 9, 2006

Link to MegaList of Resources and References: Psychology, Technology, Prevention & Intervention

Take a look at the mega-list of references and resources for psychology, technology, education, prevention and intervention posted on the TechPsych blog. Many of the references include links on-line articles and resources.

Jul 26, 2006

Visual Literacy and Multimedia Literacy Quotes - Odds and Ends PART ONE

While gathering resources and reviewing literature over the past few years, I've come across a wide range of people who have an interest in visual and multimedia literacy. I thought I'd share some odds and ends that I found helpful to me as I went along my journey.

One book that has reinforced my thinking is "In the Mind's Eye: Visual Thinkers, Gifted People with Dyslexia and Other Learning Difficulties, Computer Images, and the Ironies of Creativity", by Thomas G. West. The following quote is from a book review:

"Dr. West argues that major advances in computer information visualization technologies promise to transform education and the workplace— and to increase greatly the value in that transformed world of “visual thinkers with verbal and memory problems who have had to develop methods to sift, sample, and select” in order to understand patterns in complex systems in business, the sciences and other fields." - James Cullin

The following quote is from an article written by Gary Bertoline, the director of Purdue's Envision Center for Data Perceptualization:

“Communicating visually is becoming the norm rather than the exception in technological societies… This renaissance in graphics is coupled with the emerging re-thinking of the role of visualization in basic human intelligence. Converging technologies, a renaissance in graphics, and better understanding of the role of visualization in human cognition are the catalyst for an emerging discipline called visual science.” -Gary R. Bertoline, 1998. Visual Science: An Emerging Discipline Journal for Geometry and Graphics, V 2. 181-187 Purdue University

David Staley, the author of Computers, Visualization, and History: How New Technology Will Transform Our Understanding of the Past, also argues about the importance of visual communication, particularly in his field of history, which has traditionally been taught through reading and discussion:

“…the best visualizations are images that allow one to see, think about and understand multidimensional levels of information that would not have been apparent had it not been so spatially organized.” –Stayley, D. (2002) "Visualization-ism: An art history" Interface: The journal for education, community and values.

Robert E. Mayer
is a psychologist who has spent over the past decade studying multimedia learning. This is a quote from his book, “Multimedia Learning”, written in 2001:

“For hundreds of years, verbal messages – such as lectures and printed lessons – have been the primarily means of explaining ideas to learners….Recent advances in graphics technology have prompted new efforts to understand the potential of multimedia as a means of promoting human understanding – a potential that I call the promise of multimedia learning. “ -Mayer, R.E. 2001. Multimedia Learning New York: Cambridge University Press

As educators, how do we encourage all kinds of learners, especially those who have minds that aren’t considered to be within the mainstream in our mostly word dominant, traditional schools?

Temple Grandin, with much support and personal effort, overcame many barriers related to her symptoms of autism to earn a Ph.D. in animal science. She is known for her books and presentations related to her field of study as well as to autism. In her book, "Thinking in Picture and Other Reports from my Life with Autism", written in 1995, Grandin wrote,

“I think in pictures. Words are like a second language to me. I translate both spoken and written words into full-color movies, complete with sound, which run like a VCR tape in my head” She discussed how difficult it was for other people to understand her way of thinking"

Grandin, T. 1995. Thinking in pictures and other reports from my life with autism. New York, Doubleday p. 19

NOTE:

In the decade or so since Grandin wrote this book, there has been a significant increase in the number of students diagnosed as autism spectrum disorders. These young people often require a variety of specialized instructional strategies and support for skill development in areas such as communication and social skills.

We know that the majority of people with autism spectrum disorders are visual learners. We also know that many people who struggle in school are likely to be visual learners/thinkers. Because they learn differently, they are often viewed as having a potential learning disability or attention disorder. The emphasis on "reading to learn" in many classrooms often means that many students are not provided the opportunity to learn subject matter content through other means while they are at school.

Mel Levine, a physician who works with young people with learning and attention difficulties, addresses this issue in his book, written 2002, , "A Mind at a Time" , with a companion website:

“Too many kids struggle and fail needlessly simply because the way in which they learn is incompatible with the way they’re being taught. Schools are filled with kids who give up on themselves, are convinced they’re "losers," and conclude they’re just dumb. It’s painful—for the student, teacher, and parent who may be unaware that the "wiring" of that child’s brain simply is not in synch with the demands and expectations of the situations at hand.” -Mel Levine

“What takes place when a teacher’s ways of teaching clash with a learner’s way of learning? Chaos, discord, accusation, and anger often ensue…In facing these conflicts, should we be trying to rewire the child or instead should we modify the environment and alter our expectations? Or should we do both?” -Levine, M. 2002. A mind at a time. Simon & Schuster, pp.260

If you are a parent of a student who is considered "difficult to teach", you probably have a good understanding of what this post is about.

Some of the content of this post is from a transcript of a podcast that I started for one of my class assignments. A few of the following quotes and comments are from my notes for a paper I wrote in 2004 - "Thinking, Learning, and Communicating through Multimedia: Views from a School Psychologist", which can be found in A sense of place: The global and the local in mobile communication Nyiri, K. (ed.) (2005). Vienna: Passagen Verlag. If you look at the book's table of contents, you'll note that the various authors come from fields ranging from physics to philosophy. Technology has impacted many fields of study in significant ways!


-Lynn